Appboard/2.4/builder/data sources/sub-query: Difference between revisions
imported>Jason.nicholls No edit summary |
imported>Jason.nicholls No edit summary |
||
| (One intermediate revision by the same user not shown) | |||
| Line 2: | Line 2: | ||
[[Category:AppBoard 2.4]] | [[Category:AppBoard 2.4]] | ||
The Sub-Query data adapter is used to perform queries and transformation against other data source entities. This does not appear in the adapter type chooser when adding a data source, instead select an existing data source and click the ''Create Sub-Query'' button. | |||
Typical uses for the Sub-Query data adapter are when raw information needs to be summarized or transformed in a way to support a particular visualization: | |||
* Grouping: group by one or more columns and calculate counts, or max/min values. | |||
* Pivoting: transform row-oriented data into column-oriented data | |||
* Sub-select: select a sub-set of columns | |||
* Filtering: general operator and value based filtering to reduce the data set. | |||
* Sorting: sort by one or more columns | |||
* Limit Row Count: reduce the data set - returns the top most rows within the limit. | |||
{{Note|Data Collections also provide some overlapping functionality, specifically the ability to sort, limit rows, and filtering.}} | |||
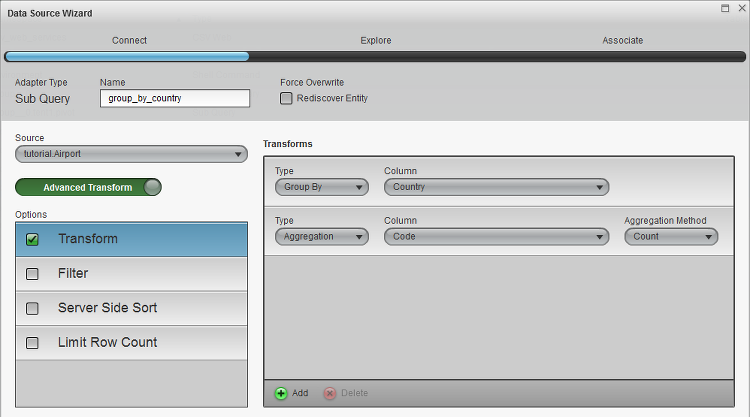
[[File:appboard-2.4-sub-query-example.png|frame|Sub-Query example configuration.]] | [[File:appboard-2.4-sub-query-example.png|frame|Sub-Query example configuration.]] | ||
=== Group-By Example === | |||
Given a raw list of items it's a fairly common task to be able to group these by some category in order to get min/max/counts for the groupings. | |||
As an example, AppBoard ships with some sample data that includes airports around the world. We want to create a new data source that provides us with a count of airports by country, this may be useful to provide a pick-list of countries for filtering, or a pie-chart with the Top-10 Countries with the highest number of airports, etc... | |||
The screenshot above shows the source as <tt>tutorial.Airport</tt>. Using the ''Advanced Transform'' option, and enabling a ''Transform'' we can then group by the <tt>Country</tt> column, and then perform an aggregation on some other column to give us a count. We could have added additional aggregation columns, such as the max and min on the <tt>Altitude</tt> column to give us some additional information about the groupings. | |||
AppBoard 2.4 ships with some welcome content including a Sub-Query data source called <tt>airport.countries</tt> which does the same as this example. It's used to drive the example content to showcase the Tile Map widget. | |||
Latest revision as of 12:27, 31 January 2014
The Sub-Query data adapter is used to perform queries and transformation against other data source entities. This does not appear in the adapter type chooser when adding a data source, instead select an existing data source and click the Create Sub-Query button.
Typical uses for the Sub-Query data adapter are when raw information needs to be summarized or transformed in a way to support a particular visualization:
- Grouping: group by one or more columns and calculate counts, or max/min values.
- Pivoting: transform row-oriented data into column-oriented data
- Sub-select: select a sub-set of columns
- Filtering: general operator and value based filtering to reduce the data set.
- Sorting: sort by one or more columns
- Limit Row Count: reduce the data set - returns the top most rows within the limit.
Group-By Example
Given a raw list of items it's a fairly common task to be able to group these by some category in order to get min/max/counts for the groupings.
As an example, AppBoard ships with some sample data that includes airports around the world. We want to create a new data source that provides us with a count of airports by country, this may be useful to provide a pick-list of countries for filtering, or a pie-chart with the Top-10 Countries with the highest number of airports, etc...
The screenshot above shows the source as tutorial.Airport. Using the Advanced Transform option, and enabling a Transform we can then group by the Country column, and then perform an aggregation on some other column to give us a count. We could have added additional aggregation columns, such as the max and min on the Altitude column to give us some additional information about the groupings.
AppBoard 2.4 ships with some welcome content including a Sub-Query data source called airport.countries which does the same as this example. It's used to drive the example content to showcase the Tile Map widget.

