Appboard/2.6/builder/diagnostics: Difference between revisions
imported>Jason.nicholls m (1 revision) |
imported>Jason.nicholls m (1 revision) |
||
| (One intermediate revision by the same user not shown) | |||
| Line 12: | Line 12: | ||
# In the header bar, click <b>Diagnostics</b>. The Diagnostics pop-up panel is displayed. | # In the header bar, click <b>Diagnostics</b>. The Diagnostics pop-up panel is displayed. | ||
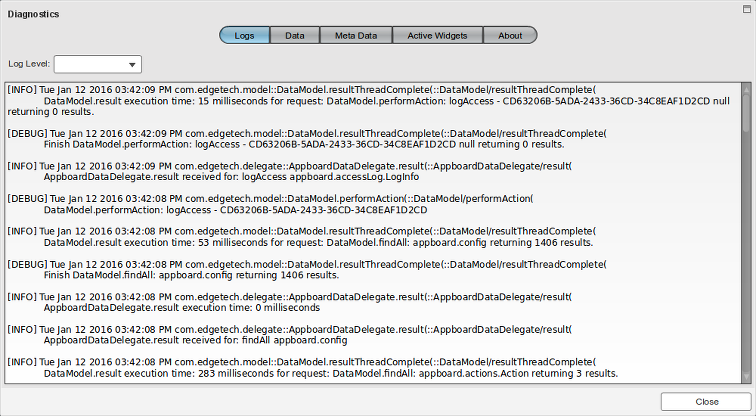
[[Image:appboard-2.6-diagnostics.png|frame|center|The Diagnostics Panel]] | |||
[[Image: | |||
== Viewing Diagnostics == | == Viewing Diagnostics == | ||
| Line 46: | Line 42: | ||
# Download and install the debug version of Flash Player from the Adobe website. | # Download and install the debug version of Flash Player from the Adobe website. | ||
# Use the special debug URL to access the AppBoard Builder: | # Use the special debug URL to access the AppBoard Builder: | ||
#: http: | #: <tt>http://<<i>host</i>>:<<i>port</i>>/enportal/ab<b>?debug=true</b></tt> | ||
| Line 64: | Line 60: | ||
=== | === About === | ||
The | The About page displays information about the AppBoard installation as reported from the server. This includes the version, build, Tomcat version, OS, Java environment, and a list of installed PIMs. | ||
Latest revision as of 07:59, 12 January 2016
The AppBoard Builder contains a Diagnostics tool to provide system information and to assist with debugging and troubleshooting. This section details the information that is provided in this tool.
Launching Diagnostics
Perform the following steps to launch the Diagnostics panel:
- Log in to the AppBoard Builder as an administrator.
- In the Builder Modes panel, click Builder. The main panel is displayed.
- In the header bar, click Diagnostics. The Diagnostics pop-up panel is displayed.
Viewing Diagnostics
Click on a tab to view the diagnostics in that category.
Logs
The Logs tab provides details about activity in the client in a rolling log format (so it will only keep 500 entries). The most recent log entries are displayed at the top. It does not include log information written on the server. The activity includes information about requests sent to the server and the processing of the results or faults, and also records information about events and actions that are performed on the client. The logs are decoupled from the server, as the server has server activity (all users), whereas the client only has information about requests the client has made and result (fault/success) information including timing and other event action information.
Each message is categorized, and you can select a Log Level to filter the messages to only display messages of only certain types:
- All - Show all messages of any type
- Debug - Show messages that are labeled as type: "DEBUG", "INFORMATION", "WARNING", "ERROR, or "FATAL"
- Information - Show messages that are labeled as type: "INFORMATION", "WARNING", "ERROR, or "FATAL"
- Warning - Show messages that are labeled as type: "WARNING", "ERROR, or "FATAL"
- Error - Show messages that are labeled as type: "ERROR or "FATAL"
- Fatal - Show only messages that are labeled as type: "FATAL"
Many log messages can provide additional detail if the debug version of Flash Player is used. Perform the following steps to display the debug messages in the Diagnostics log viewer:
- Download and install the debug version of Flash Player from the Adobe website.
- Use the special debug URL to access the AppBoard Builder:
- http://<host>:<port>/enportal/ab?debug=true
Data
The Data tab shows every piece of data that is currently loaded in the client. This can be used to inspect other attributes that are not visible on a given widget (or you can look at the data collection). You may need to look here if the data was returned in an association; as it would not be visible in the data collection manager. This can also be used to inspect the configuration of the stacks, boards, and widgets.
Meta Data
The Meta Data tab shows the structure of the data used or displayed in the client. The list will show the different entities (each type of data), and for each entity the properties that were discovered.
Active Widgets
The Active Widgets tab confirms which Widgets are currently running (listening or requesting data updates). If a Widget is not getting updated, you can check on this screen to verify if the Widget is considered to be active. You may also want to verify the settings of the collection to see if it is being updated (polling configuration); or if it's a Board Context data collection verify the parent collection is being updated (polling configuration).
About
The About page displays information about the AppBoard installation as reported from the server. This includes the version, build, Tomcat version, OS, Java environment, and a list of installed PIMs.

