Appboard/2.5/builder/widgets/html widget/example sankey widget: Difference between revisions
imported>Jason.nicholls No edit summary |
imported>Jason.nicholls |
||
| Line 16: | Line 16: | ||
==Configuration== | ==Configuration== | ||
To access the widget configuration you must be logged in with the | To access the widget configuration you must be logged in with the <tt>portalAdministration</tt> role and in the Builder. Click on the wrench icon in the top-left of the widget. | ||
[[File:appboard-2.5-examplesankeywidget-configuration.png|frame|center|exampleSankeyWidget configuration page.]] | [[File:appboard-2.5-examplesankeywidget-configuration.png|frame|center|exampleSankeyWidget configuration page.]] | ||
Revision as of 09:53, 6 March 2015
Overview
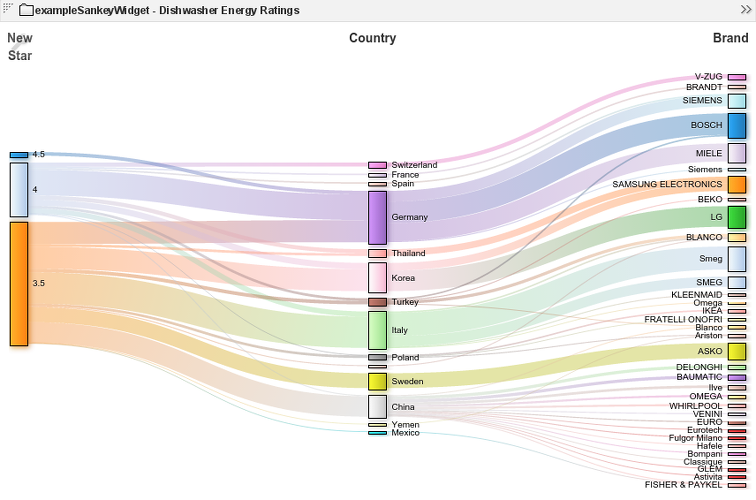
A Sankey diagram is very useful in depicting flows between related items (nodes). The size of the flow represents a relative quantity with respect to the other flows, and the node size also reflects the relative quantity passing through, or beginning or ending at that node.
The exampleSankeyWidget is a basic implementation based on the D3.js Sankey plugin. Data is passed in from AppBoard and then based on the widget configuration is summarized to produce the diagram.
Configuration
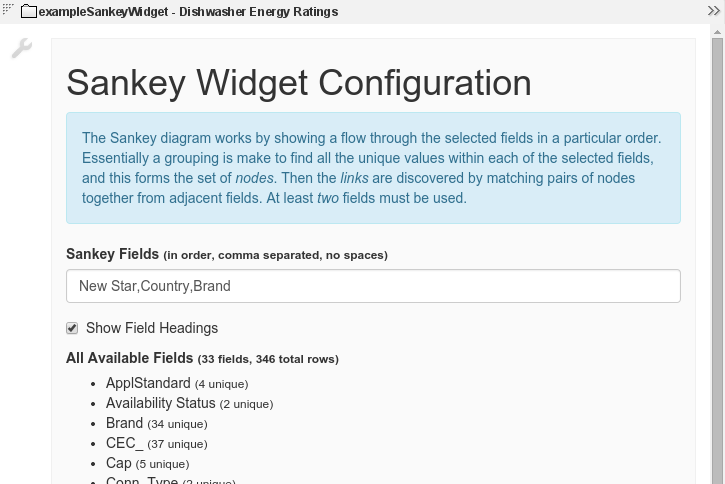
To access the widget configuration you must be logged in with the portalAdministration role and in the Builder. Click on the wrench icon in the top-left of the widget.


