Appboard/2.6/builder/widgets/html widget/small multiples widget: Difference between revisions
imported>Doug yeager |
imported>Jason.nicholls m (1 revision) |
(No difference)
| |
Revision as of 05:14, 4 December 2015
Overview
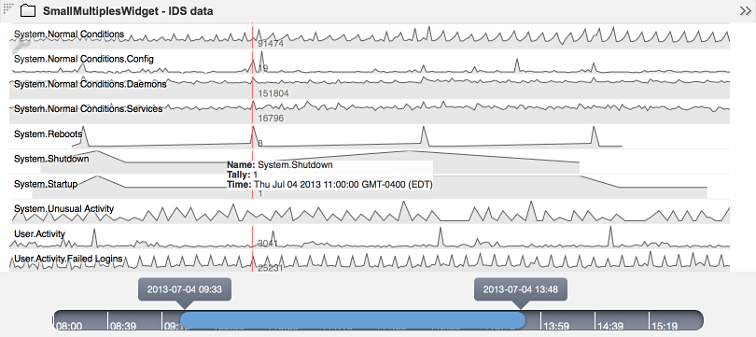
The Small Multiples Widget provides a way to plot a high density of information in the form of stacked area charts in order to perform visual correlation between time-series information that share the same time period. In conjunction with performance improvements with Data Collection processing in AppBoard 2.6, this high-performance component can display 100,000s of data points split across the multiple data series.
Mouse interaction with the widget highlights the series under the mouse and adds a vertical indicator for the nearest valid data point, as well as highlighting the same data point for all other series that have a data point for the same timestamp.
Configuration
To access the widget configuration you must be logged in with the portalAdministration role and in the Builder. Click on the wrench icon in the top-left of the widget.
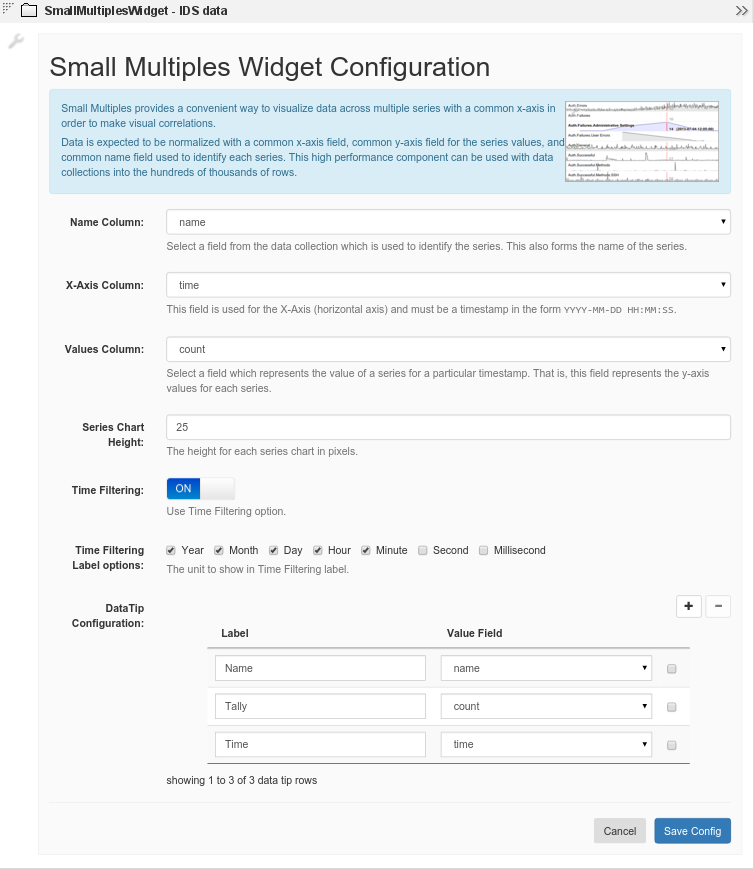
This widget expects a data collection where the Name Column is used to identify the series and also for the display name, the X-Axis Column represents the shared time-series timestamps in the form YYYY-MM-DD HH:MM:SS, and the Values Column has the actual data-points.
In addition the series chart height can be modified to suit.
Actions are also supported by this widget by configuring normal AppBoard actions.


