Appboard/2.4/builder/data sources/sub-query: Difference between revisions
imported>Jason.nicholls No edit summary |
imported>Jason.nicholls No edit summary |
||
| Line 2: | Line 2: | ||
[[Category:AppBoard 2.4]] | [[Category:AppBoard 2.4]] | ||
The Sub-Query data adapter is used to perform queries and transformation against other data source entities. This does not appear in the adapter type chooser when adding a data source, instead select an existing data source and click the ''Create Sub-Query'' button. | |||
Typical uses for the Sub-Query data adapter are when raw information needs to be summarized or transformed in a way to support a particular visualization: | |||
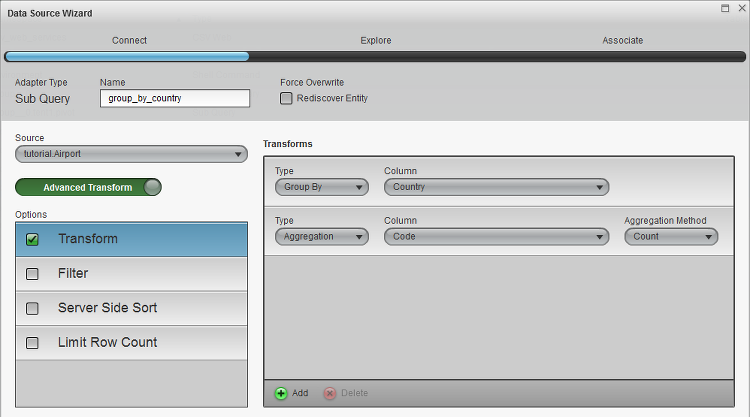
* Grouping: group by one or more columns and calculate counts, or max/min values. | |||
* Pivoting: transform row-oriented data into column-oriented data | |||
* Sub-select: select a sub-set of columns | |||
* Filtering: general operator and value based filtering to reduce the data set. | |||
* Sorting: sort by one or more columns | |||
* Limit Row Count: reduce the data set - returns the top most rows within the limit. | |||
{{Note|Data Collections also provide some overlapping functionality, specifically the ability to sort, limit rows, and filtering.}} | |||
[[File:appboard-2.4-sub-query-example.png|frame|Sub-Query example configuration.]] | [[File:appboard-2.4-sub-query-example.png|frame|Sub-Query example configuration.]] | ||
Revision as of 10:48, 31 January 2014
The Sub-Query data adapter is used to perform queries and transformation against other data source entities. This does not appear in the adapter type chooser when adding a data source, instead select an existing data source and click the Create Sub-Query button.
Typical uses for the Sub-Query data adapter are when raw information needs to be summarized or transformed in a way to support a particular visualization:
- Grouping: group by one or more columns and calculate counts, or max/min values.
- Pivoting: transform row-oriented data into column-oriented data
- Sub-select: select a sub-set of columns
- Filtering: general operator and value based filtering to reduce the data set.
- Sorting: sort by one or more columns
- Limit Row Count: reduce the data set - returns the top most rows within the limit.

