Appboard/old/widgets/timeline
Revision as of 13:16, 27 June 2013 by imported>Mike.berman (created page)
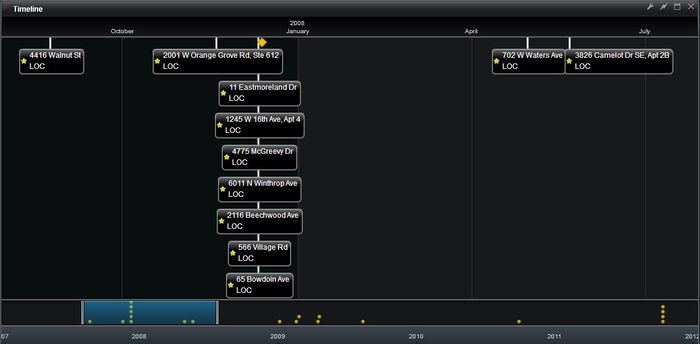
The Timeline Widget allows users to display data containing events and their dates/times in a widget that visually represents the different types of events occurring and when they occur in relation to other events in the collection over a span of time.
How To Create a Timeline Widget
Before you can successfully configure a Timeline Widget, you must configure the following:
- Edit the Data Source of the Data Collection that will be used in the Timeline Widget.
- Navigate to the Explore section and expand the folder containing the data that will be used in the widget.
- For the field that will represent the Date/Time in the widget, select the Date option under Type.
- You can click the Apply Format button that appears to manually select the appropriate Date/Time format that fits to your data.
- Click Next and Finish.
For instructions on creating a Widget, see the general instructions in Adding Widgets. The Timeline Widget type is located under the Diagrams category on the Widget selection screen.
How To Configure a Timeline Widget
- Follow the instructions above to create the basic Timeline Widget.
- Enter the following information on the Data tab:
- Data Collection: Select the name of the Data Collection that will provide the data to be displayed in the Timeline. Note: For convenience, buttons are provided for Adding, Editing, or Previewing a Data Collection.
- Date Field: Select the field that contains the Date/Time that will be displayed in the widget. If no fields are available, see the instructions in How To Create a Timeline Widget above.
- Label Field: Select the field that will be displayed as a label for an event in the Timeline.
- Second Label Field (optional): This field will be displayed as a secondary label for an event in the Timeline.
- Show All Data: By checking this box, the widget will condense the Timeline so that all events are shown in the Timeline without the need to scroll. If the box is unchecked, the widget displays a longer Timeline with data spread out so that the user can use a bar at the bottom of the widget to scroll through and the time distance between events can be viewed more accurately (especially in longer timelines).
- Message Text: This is the text that will be displayed when there is no data coming from the Data Collection that can be displayed in the Timeline.
- Click Next to move on to the Status tab.
- Optionally configure status rules available on Status tab:
- Background Color: Enabling this option lets you set up rules that allow the data to determine the background color of each item in the list.
- Icon: Enabling this option lets you set up rules that allow the data to determine the icon used for each item in the Timeline.
- Status Shape: Enabling this option lets you set up rules that allow the data to determine a status shape and color for each item in the Timeline.
- Note: None of items are required for the Timeline Widget to function.
- Click Next to move on to the Options tab. For details on the available Options, see Options.
- Click Next to proceed to the Actions tab.
- Click Add Event Action to configure one or more Actions to be invoked when a user clicks on data in the Timeline.
- Click Finish.
- In the Builder Modes panel, select Builder and navigate to the appropriate Board to observe the new Timeline Widget.
Sample Exercise
Follow this exercise to walk through creating and configuring a basic Timeline Widget.
- Go to the Data Sources panel and add a new Data Source.
- Name the Data Source "sample.Timeline_Data".
- For the type, select File and select the CSV File option.
- Click Add Data Source.
- Now in the Connect section, under File Path click the blue magnifying glass.
- Navigate to pkg\appboard\test and select timeline_sample_data.csv.
- Click Next to proceed to the Explore section.
- Expand the folder by clicking the arrow next to the timeline_sample_data folder icon.
- Set the Type for InformationDate to Date.
- For the purposes of this exercise, the other fields can remain unchanged.
- Click Next and Finish to complete the Data Source configuration.
- Create a Stack called Timeline_Example using the Quick Action Add Stack button.
- Click the Add Widget Quick Action button.
- Select Timeline_Example as the Board.
- Select Timeline under the Diagrams Type.
- Click Add Widget.
- Now in the Data section of the wizard, select the sample.Timeline_Data Data Collection.
- For the Date Field select InformationDate. This should be the only option available because of what we did in step #4.
- Select Name as the Label Field.
- Select Type as the Second Label Field.
- Click Next, Next, Next, and Finish.
- Go to the Builder and you should see a Timeline Widget with data. Use the blue bar to scroll left and right through the Timeline.
- Go back and explore the other features in the Widget Wizard for customization options.

