Appboard/2.4/builder/widgets/tile map
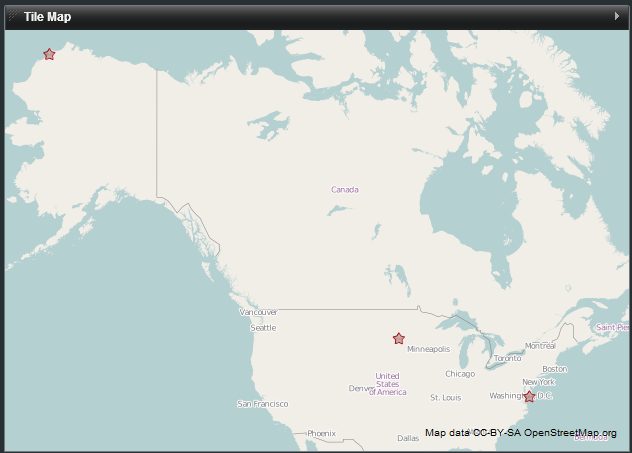
The Tile Map Widget displays tile-based maps from a server that conforms to the Open Street Maps architecture.
This Widget provides advantages over the Vector Map Widget because it can show details such as streets and satellite imagery. The Widget also provides advantages over the Google Map Widget, because it does not require an internet connection and is not reliant upon the Google mapping technology and data.
As in other AppBoard map Widgets, the data source for the Widget must contain fields with Longitude and Latitude for each node to be drawn on the map.
The use of KML is not supported in the Tile Map Widget.
How To Create a Tile Map Widget
For instructions on creating a Widget, see the general instructions in Adding Widgets. The Tile Map type is located under the Maps category on the Widget Type selection screen.
How To Configure a Tile Map Widget
- Follow the instructions above to create the basic Tile Map Widget.
- Enter the following information on the Data tab:
- Data Collection - Select the name of the Data Collection that will provide the data to be displayed in the Tile Map.
- For convenience, buttons are provided for Adding or Editing a Data Collection.
- If you are using the AppBoard Sample Chart Data, select the sample.Data.Airport Data Collection.
- The selected Data Collection must contain two separate fields with geographical coordinates representing the Latitude and Longitude of each node to be drawn on the map.
- Widget Name - Enter the name to display for the Widget in the Widget Title Bar.
- [Optional] Configure an Alternate Widget to be displayed on mobile devices, since this Widget is only supported for display in the desktop AppBoard Viewer.
- Data Collection - Select the name of the Data Collection that will provide the data to be displayed in the Tile Map.
- Enter the following information on the Visualization tab:
- Map Tiles - Select the tile style or server that you wish to use from the list of available tile types.
- Latitude Field - Select the column of data that provides latitude coordinates.
- Longitude Field - Select the column of data that provides longitude coordinates.
- Marker Type - Toggle this switch to choose the type of image to draw for each node on the map:
- Status Shape - Display a colored shape for each node on the map
- Icon - Display an icon with a status shape in the top left corner for each node on the map.
- Auto Zoom - Toggle the automatic zoom controls:
- Off - The full map is displayed when the Widget is invoked on the Board.
- Fit To Data - AppBoard will automatically zoom to the "best fit" zoom level when the Widget is invoked on the Board.
- Default Shape - The default shape to use when the "Status Shape" Marker Type is selected (see above).
- Default Color - The default color to apply to the shape when the "Status Shape" Marker Type is selected (see above).
- Default Shape Size - The default size to use for the shape when the "Status Shape" Marker Type is selected (see above).
- [Optional] Colored Shape Filter - Select the name of the filter you would like to use or click "Add" to create a new filter. A Color Filter allows you to set rules for displaying different colors for the markers on the map where certain conditions are met in the corresponding data. For more information, see Colored Shape Filter
- [Optional] Default Icon - When the "Icon" Marker Type is selected (see above), this item selects the icon to display for each node.
- [Optional] Icon Size - When the "Icon" Marker Type is selected (see above), this item determines the size of each icon.
- [Optional] Icon Badge Filter - When the "Icon" Marker Type is selected (see above), this allows for different icons to be displayed conditionally based on the attributes of each individual node on the map.
- Preview - This section provides a small preview of the Tile Map.
- Provide additional configuration on the Options tab. For details on the available Options, see Options.
- Click Close.
- In the Builder Modes panel, select Builder and navigate to the appropriate Board to observe the new Tile Map Widget.
Importing Offline Tile Data
The Tile Map Widget supports the use of custom tiles as offline tile data. Perform the following steps to import offline tile data into AppBoard for use in the Tile Map Widget:
- Open a terminal window (i.e., CMD/shell prompt)
- Shutdown the AppBoard server
- Change directory to [Install_Home]/server/bin/
- Run the following command:
- UNIX: ./portal.sh FilesImport -jar <OfflineTilePackage>
- Windows: portal.bat FilesImport -jar <OfflineTilePackage>
Creating Custom Tiles From Images
The first 3 subsections are snapshot of the instructions found at: http://bryce-thomas.blogspot.com/2012/01/noobs-guide-to-creating-google-maps.html
Finding the geographic coordinates of the image
For a long time the hardest part has been trying to accurately figure out the coordinates of an overlay image. Things got a little easier a few months ago with the release of Overlay Tiler. A slightly modified version of the original Overlay Tiler is employed in the following steps (which you should now perform): Upload your image to a location on the Web where you can publicly link it. Dragging and dropping your image onto the imgur homepage is one option that will give you a direct link. Visit http://overlaytiler.appspot.com/. In the Enter a location box, enter the name of the landmark your image will overlay and choose one of the auto-completed options. If no appropriate auto-complete option comes up, forget about it. Paste a link to your uploaded image from Step 1 in the Upload an image to overlay box and hit Upload. Step 3 should have taken you to a page with your image overlaid on top of Google Maps. Use the green node in the centre of the image to centre the image on top of the respective Google Maps landmark (if it's not already). You can use the standard Google Maps zoom controls and also the slider in the top left hand corner to adjust the image's opacity, which will make lining things up easier. Use the three red circles on the image corners to manipulate the image until it accurately traces the landmark1. You'll notice as you do this that the command text in the bottom right hand corner continuously updates—we'll use this command in Part II to generate geographic metadata for our image.
Posted 11th January 2012 by Bryce Thomas
Adding geographic metadata to the image
Now that you've lined up your image over Google Maps, you're going to add some geographic metadata to your local copy of the image. Download OSGeo4W and install it. The "Express Desktop Install" is fine and you only need to tick "GDAL" when it asks you to select packages—all we want is access to the gdal_translate command. Look for OSGeo4W Shell on the Start Menu and launch it. Change into the directory with your image (e.g. cd C:\John\Pics). Copy the entire gdal_translate command from the bottom right hand corner of the Overlay Tiler Web page into the console, replacing [my_image] with the filename of your image locally. Note that you'll probably need to copy the command into something like Notepad first and remove all the backslashes and newlines, so you've got a command like: gdal_translate -gcp 0 0 178.71874950000017 -7.2265307089195225 -gcp 275 0 -128.37109424999983 -7.9235151584510195 -gcp 275 95 -128.37109424999983 -23.92125118057006 [my_image].png out.tif (all on a single line). If you try to copy it straight into the console it'll execute the first line only and complain loudly. In your image directory, you should now have a file named out.tif which looks just like your original file, but now with some hidden geographic metadata.
Posted 11th January 2012 by Bryce Thomas
Generating Map Tiles
Now that we've got an image with geographic metadata attached, it's time to generate the tiles. Download and install MapTiler. Start MapTiler and select Google Maps compatible when it asks you what kind of tiles you'd like to generate. Hit Continue. Add your .tif image to the source data files and hit Continue. Select WGS84 - Latitude and longitude (geodetic) as the Spatial reference system. If you hit Preview the map reference with this SRS a browser tab will open showing you the boundaries of where your image will fit on Google Maps. This should give you confidence that the georeferencing has worked. Hit Continue. Choose the zoom levels you want tiles generated for, or simply stick with the defaults. Hit Continue. Choose the directory to save the map tiles into and hit Continue. Leave the default selection of viewers and hit Continue. Change the title of the map if you want and hit Continue. Hit Render. Once rendering is done, click on the directory link MapTiler provides and you should see several numbered directories (one for each zoom level) and googlemaps.html and openlayers.html documents. Open up googlemaps.html and you should see your tiles rendered as an overlay! Try zooming in and out.
Posted 11th January 2012 by Bryce Thomas
Using the Custom Tiles in Appboard
- Copy the numbered directories created in the first 3 steps to: server\webapps\enportal\custom\tiles\[customFolderName]
- Create a file: server\webapps\enportal\WEB-INF\xmlroot\appboard\config\tileregistry\[myCustomTilesName].csv
- Insert the following as the header for the CSV (or use the default.csv file in the same directory as a template
"id","name","source","minZoom","maxZoom","initialZoom","initialLatitude","initialLongitude","copyright"
- Place an entry with the details for your tiles like the following example:
"washington","Washington","/enportal/custom/tiles/washington/${z}/${x}/${y}.png",12,14,12,38.889,-77.03,"Copyright Information"
User Options
The following options are available to the end-user in the AppBoard Viewer for the Tile Map Widget.
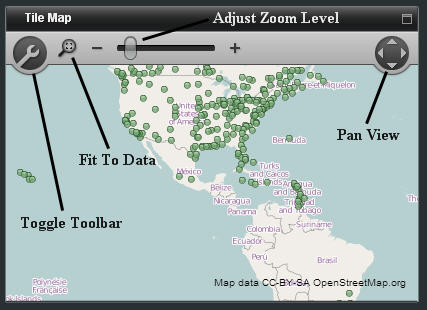
- Toggle Toolbar - Shows or hides the toolbar containing the map viewing options
- Fit To Data - When clicked, AppBoard will automatically zoom to the "best fit" zoom level based on the location of the data points
- Adjust Zoom Level - Increases or decreases the zoom level of the map
- Pan View - Adjusts the field of view of the map horizontally or vertically


