Appboard/2.6/overview
Revision as of 10:59, 30 April 2015 by imported>Jason.nicholls (1 revision)
AppBoard is a data visualization tool that works by fetching data from a variety of data sources and caches, transforms, associates, and then presents the data in a set of dashboards. AppBoard dashboards are not static however, as actions can be defined to perform drill-downs, filter content, show additional details, and more. As a result it's possible to build highly interactive dashboards that allows users to quickly both visualize data and zero-in on the information they need to perform their job.
Building dashboards in AppBoard is easy using the Builder tool which is a graphical Adobe Flash based client. All configuration is GUI based including configuring collecting and managing data, building out content, and other system administration functions.
End-users of the system use the AppBoard Viewer which is also a Adobe Flash based client. This provides users with a restricted set of dashboards with the ability to interact but not modify the contents or behaviour.
Basic Concepts
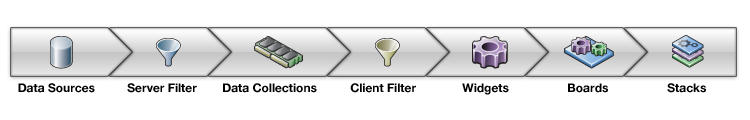
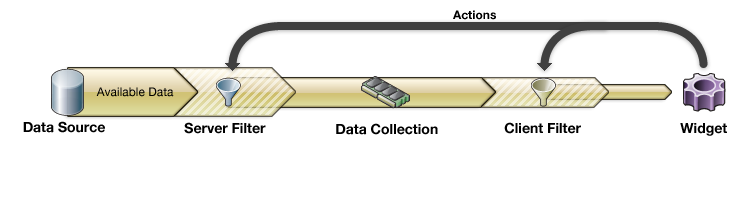
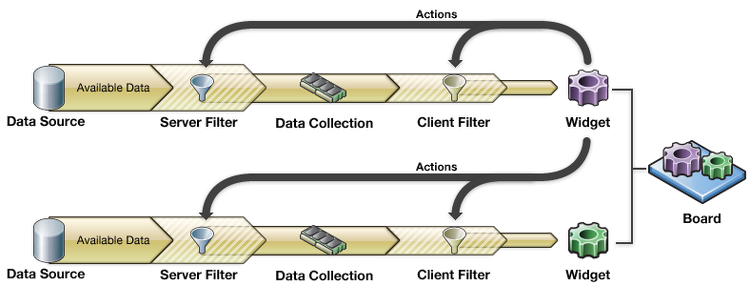
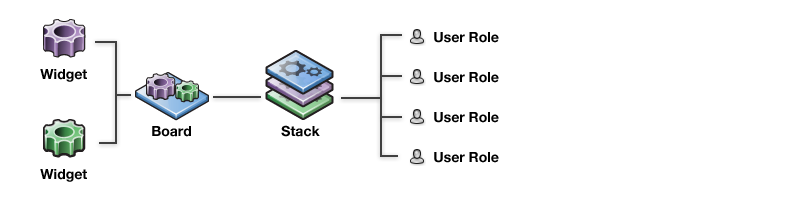
At the top level, the dashboards a user can see are represented by Stacks which are a collection of Boards. Each Board is a separate dashboard in its own right with its own set of visualization Widgets. Widgets visualize a Data Collection that may have been filtered on the server side, or the client side. Finally these data collections are driven by data from external Data Sources such as databases.
As an AppBoard administrator tasked with building dashboards the process is roughly broken into two parts:
- Content Design & Management:
- Design one or more dashboards for a target organizational role, keeping in mind the data to drive the dashboard has to come from somewhere. Designing dashboards is a skill on it's own and we recommend books such as Information Dashboard Design by Stephen Few in order to build pertinent dashboards for the target audience.
- Determining how to present the data, which widgets, how it should be laid out, and how the user will interact via actions if any.
- Data Management:
- Finding where data resides in order to produce the desired visualizations
- Accessing the data (creating data sources)
- Understanding how to transform the data, if needed, in order to drive the desired visualizations (using sub-queries, data collections, data processing scripts, and perhaps external to AppBoard)
- Understanding how the data may need to be associated with other data
- Understanding how the data may need to be filtered
Data Sources
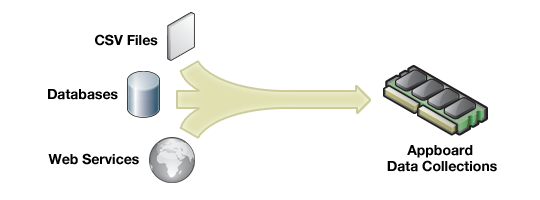
Good data visualization requires good data. This data can be stored in a variety of different locations and formats, which can lead to problems when trying to create holistic summary views. AppBoard has a dedicated "Data Source" mode that allows you to access all this information, regardless of where it is or what format it is in.
Another challenge to data visualization is that the raw data available from these "data sources" must first be manipulated or optimized before it can be useful. AppBoard provides you with some powerful data manipulation tools to optimize data so that it can be effectively visualized.
- AppBoard gives you the ability to Group, Pivot, and Sort information both on the client, and at the server.
- "Server Side Filters" also allow you to optimize large data sets before you bring it into a memory on the client.
- "Client Side Filters" allow you to take advantage of information that's already available in client memory.
- Data caching also provides a way to optimize performance to clients and also reduce the load on the back-end data source.

For more information refer to the Data Sources page.
Data Collections
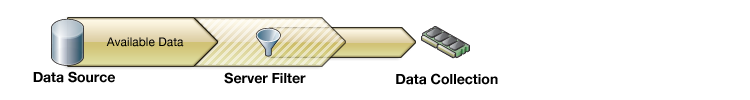
Any data that is pulled into AppBoard gets placed into a "Data collection". This information is stored in memory on the client, so it is rapidly available to any widget or board that has appropriate permissions. Like "Data Sources", AppBoard has a dedicated mode that allows you to manage all your "Data Collections". The "Data Collections Wizard" allows you to control how much information you are bringing into memory via "Server Side Filter", but you can also manipulate the data already in memory via "Client Side Filter".
Data Collections are the foundational block that all AppBoard visualizations are based upon. For more information refer to the Data Collections page.
Widgets
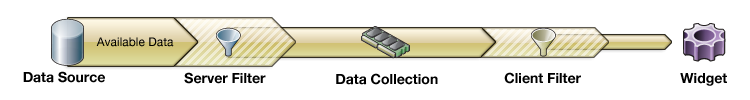
Data visualization inside AppBoard is done by associating a Data Collection with a Widget. AppBoard contains a number of widgets, but every widget requires a Data Collection.
On top of just visualizing data, Widgets allow you to configure "Actions". For example, you can contextually filter one widget based on a selection in another, or you can drill down into a child board that shows details based on an item selected in the parent. The key is knowing that when you click on a Widget, you're actually clicking on the piece of data that's being represented by the widget. Actions allow you to use this piece of data as context to alter client or server side filters for any Data Collection inside AppBoard. This flexibility allows for extremely powerful interactions.
Refer to the Widgets page for more information.
Stacks and Boards
In AppBoard, Widgets are placed on "Boards". A collection of Boards is called a "Stack".
Each stack has a corresponding tab in the banner area of the builder which lets you navigate to that stack. Stacks are an important concept because provisioning is done at the stack level by assigning stacks to roles.
Refer to the main Builder page for more information on Stacks, Boards, and Provisioning.
