Appboard/old/widgets/topology 2.2
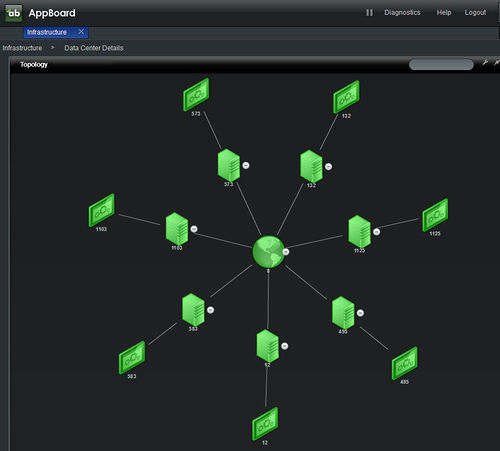
A Topology Widget is a diagram that displays the visual layout of devices that are connected to one another, typically on a computer network.
How To Create a Topology Widget
For instructions on creating a Widget, see the general instructions in Adding Widgets. The Topology Widget type is located under the Diagrammer category on the Widget selection screen.
How To Configure an Area Chart Widget
Follow the instructions above to create the basic "Topology" Widget, and then perform the following steps to configure an Area Chart Widget:
Select a Data Collection
Select a Data Collection that contains the information you would like to use for this Widget.
- Click the "Data Collection" pulldown, then select from the list of available Data Collections.
- If there are no Data Collections available in the pulldown, then click here for instructions on how to bring in some Sample Chart Data, or refer to Add/Edit/Remove a Data Collection.
See the Sample Data section below for instructions on using sample data to create a Topology Widget
The Topology Widget uses a field called "children" to determine how data items are related to one another. To use the Widget, you must first create a Data Source with an Association. On the "Associate" tab of the Data Source editor, create a field called "children" which associates one entity to another. For example, you could associate the Host_Name field in a datacenter table with the Host_Name field in a server details table. Then have the Topology Widget use a Data Collection which uses this Data Source. The Widget will use the "children" association to draw the topology.
Configuring the Label Field
Select the desired Label Field to use for naming the items in the topology display.
Status Rules - Color Filter
[Optional] Click Add to create a set of Color Filter rules which will determine the coloration of the icons for each node in the Topology diagram, based on the attributes of that node.
Icon Rules - Icon Filter
[Optional] Click Add to create a set of Icon Filter rules which will determine the icon to display for each node in the Topology diagram, based on the attributes of that node.
Additional Configuration Steps
- Provide additional configuration, if needed, on the Options tab. For details on the available Options, see Options.
- Enter the following information on the Actions tab:
- Click Add Event Action to configure one or more Actions to be invoked when a user clicks on the Topology Widget. The action will apply to the current data record being displayed.
Sample Data
Perform the following steps to create a Topology Widget using sample data provided with Appboard:
Create a Data Source
- Log in to AppBoard Builder as an administrator.
- In the Builder Modes panel, select Data Sources.
- Click the "Add" button in the bottom toolbar. The "Create New Data Source" dialog is displayed.
- Type in the name "Sample.TreeMap".
- Select the "File" category for the adapter type, then choose "CSV File".
- Click the "Add Data Source" button in the bottom toolbar.
- The "CSV File" Data Source Wizard is displayed.
Configure the Data Source
- For the File Path, enter ${application.home}/data/pkg/appboard/tutorial/TreeMapData.csv.
- Click "Next" in the bottom toolbar.
- On the "Explore" step, click "Next".
- On the "Associate" step, click "Add Association".
- For "Add Field", enter "children". This is the name the Tree Map Widget uses to determine associations.
- Use the "Select Entity" drop-downs to set an association of "sample.TreeMap.TreeMapData.Network_ID" = "sample.TreeMap.TreeMapData.Parent_ID"
- Click "Finish".
Configure the Data Collection
- In the Builder Modes panel, select Data Collections.
- Click "Add".
- Name the Data Collection "sample.Topology"
- For the Data Source, select "sample.TreeMap.TreeMapData"
- Click Next to go to the "Client Side Filter" panel
- Add a Rule of type "Simple Property Comparison"
- Enter the property "Network_ID" "=" "2"
- Click "Finish".
Configure the Widget
- For the Data Collection, select "sample.Topology"
- For the Label Field, select "Location"
- For the Area Field, select "Outages"
- Add a Color Filter called "Topology Colors"
- Select "Add Color" six times to add six rows
- For the first rule, select the red color and set the rule to be "Color" "=" "Red"
- Repeat the same step for the colors green, gray, blue, white, and brown
- Click "X" to close the Color Filter editor
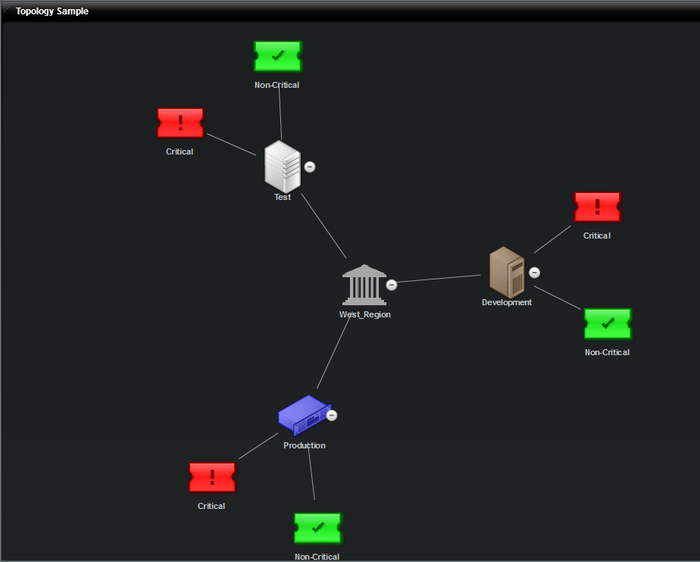
- Add an Icon Filter called "Topology Icons". Configure the icons such as illustrated in the following diagram:
The completed Widget should provide a display similar to the following:


