Appboard/2.4/builder/filtering
AppBoard features a common concept throughout the product around filters and filtering. These are configured to reduce down data collections, to drive indicators in visualizations, and for controlling which click-actions are fired:
- Data Filters:
- Server Side Filters (SSF): reduce the size of a data collection on the server side, i.e. client only receives reduced set of data. Server side filters are also used to drive SHIM query parameters.
- Client Side Filters (CSF): performed on the client to reduce the size of a data collection. The full data collection is received by the client from the server.
- Search Text: A widget option to allow end-users to filter using plain text.
- Visualization Filters:
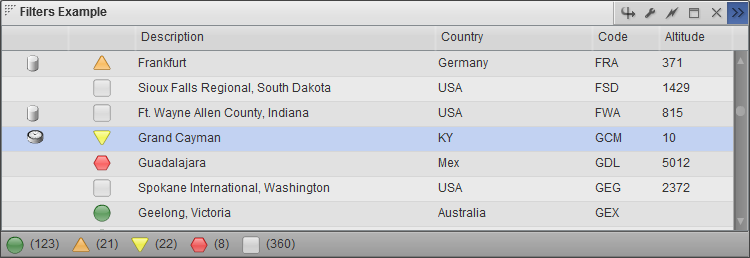
- Icon: determine icon to display based on filter conditions
- Color: determine color to show based on filter conditions
- Colored Shape: combination color and status shape filter
- Widget Options Filter or Quick Filter: either an Icon or Colored Shape filter that adds a button bar to the bottom of a widget to allow for quick filtering by the end-user.
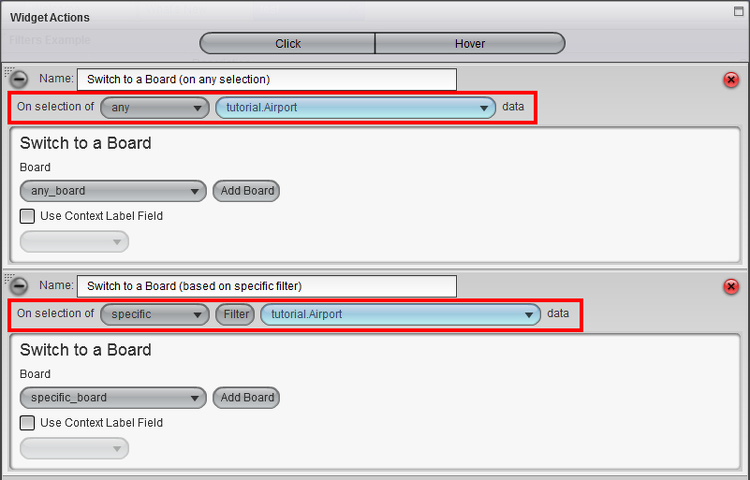
- Action Filter: determines whether an action should be triggered based on what was clicked by the end-user.
Data Filters
Both Server Side Filters and Client Side Filters can be configured:
- As part of the Data Collection configuration.
- By defining widget actions.
SSFs and CSFs can be used at the same time. If a data collection is configured with a SSF or CSF, and a widget action then sets a new SSF or CSF, this will replace the configured filter.
Why server-side vs client-side? By performing filtering on the server the total data sent to the client can be reduced. This is especially useful if only a fraction of the total data collection is ever to be seen at one time. SSFs are also required if using SHIM query parameters.
Why client-side vs server-side? Filtering on the client side saves a round-trip to the server and time to transfer the response, so for smaller datasets where a lot of interactivity is expected then client side filtering can offer a better/faster response to the end-user. Client side filters also offer an additional rule type allowing regular expression matches.
Ultimately the decision for server or client side filtering will depend on the circumstance covering the size of the data and how an end-user is going to be interacting with that data.
Data Collection configuration vs via action? Typically if a filter is configured as part of a data collection configuration then this represents the default set of data that should be visible. When SSFs or CSFs are set via widget action it's typically to further filter based in the context of something the end-user has clicked on. Whether this is to drill-down to another board, or simply updated widgets already on the screen.
Another form of data collection filtering is the Show Search Text Option available when configuring widgets. Enabling this option provides a search icon in the widget title bar and when this is toggled by the end-user allows them to enter plain text which is used to further filter the data collection driving that widget.
For more information please refer to:
- Managing (configuring) Data Collections
- Apply a Server Side Filter to a Data Collection Action
- Apply a Filter to a Data Collection (Client Side Filter) Action
- Show Search Text Option
Visualization Filters
Visualization filters are used in widget configuration, diagrams, and relationships. They are typically used to classify data in order to determine what icon to show, what shape to show, what color to show, what background color, etc...
From AppBoard 2.4.1 it's possible to share filters of the same type as long as the rules within the filter match against attributes of the selected data collection. This should save duplication of filters from widget to widget.
Note that depending on the widget capabilities that editing a filter may present some additional options such as a Label (for Quick Filters), or specifying the size of the visualization.
For more information please refer to:
Widget Action Filters
Depending on what an end-user has clicked on an administrator may want to control what set of actions get fired. The ability to fire actions in-context allows for a great deal of flexibility when designing and implementing dashboards.
As example, take a visualization which presents regional locations, main offices, and data centers all on the same map. If the location type information is available within the data collection then this can be used to drive visualization filters to visually indicate the difference between locations, and an administrator can configure actions to fire based on the location type too. Such as each location type taking the end-user to a different drill-down board based on that type.
For more information please refer to the Widget Actions page.


